TJH Annual Report

A helpful place to also put any annual reports etc, of your own portfolios
Post Reply
tjh290633
Lemon Half
Posts: 7675
Joined: November 4th, 2016, 11:20 am

TJH Annual Report

Post by tjh290633 »

The result table for my portfolio up to the end of the current Financial Year (effectively today) is as follws:
.            Income Units              Accumulation                  April       
Year to      Unit Value     Div/Unit   Unit Value     FT30   FT100   RPI     RPI 
21-Apr-87            1.00       0.00           1.00   1.00    1.00   1.018   1.00
05-Apr-88            0.91       2.86           0.94   0.92    0.91   1.058   1.04
05-Apr-89            1.18       2.72           1.28   1.10    1.05   1.143   1.12
05-Apr-90            1.21       4.24           1.40   1.13    1.14   1.251   1.23
05-Apr-91            1.34       5.42           1.69   1.28    1.26   1.331   1.31
05-Apr-92            1.30       7.52           1.75   1.24    1.26   1.388   1.36
05-Apr-93            1.51       6.91           2.13   1.44    1.46   1.406   1.38
05-Apr-94            1.70       6.27           2.50   1.65    1.65   1.442   1.42
05-Apr-95            1.66       7.48           2.55   1.57    1.62   1.490   1.46
05-Apr-96            1.95       7.38           3.13   1.80    1.90   1.526   1.50
05-Apr-97            2.16       8.40           3.62   1.85    2.21   1.563   1.54
05-Apr-98            3.31      10.00           5.72   2.45    3.05   1.626   1.60
05-Apr-99            3.44       8.46           6.12   2.47    3.21   1.652   1.62
05-Apr-00            3.32      11.33           6.13   2.42    3.35   1.701   1.67
05-Apr-01            3.29      12.42           6.32   2.05    2.89   1.731   1.70
05-Apr-02            3.37      13.02           6.76   1.65    2.69   1.757   1.73
05-Apr-03            2.29      12.10           4.85   0.85    1.85   1.812   1.78
05-Apr-04            2.92      13.38           6.56   1.22    2.25   1.857   1.82
05-Apr-05            3.46      13.06           8.10   1.33    2.51   1.916   1.88
05-Apr-06            4.30      17.42          10.57   1.68    3.06   1.965   1.93
05-Apr-07            4.91      19.42          12.63   1.90    3.31   2.054   2.02
05-Apr-08            4.14      24.32          11.21   1.58    2.93   2.140   2.10
05-Apr-09            2.28      21.17           6.46   0.87    2.01   2.115   2.08
05-Apr-10            3.69      11.06          10.86   1.33    2.91   2.228   2.19
05-Apr-11            4.16      16.71          12.76   1.43    3.03   2.344   2.30
05-Apr-12            4.40      17.73          14.19   1.33    2.96   2.408   2.37
05-Apr-13            5.27      21.83          17.01   1.54    3.29   2.476   2.43
05-Apr-14            5.34      23.05          18.88   1.75    3.38   2.557   2.51
05-Apr-15            5.91      24.98          21.84   1.91    3.47   2.580   2.53
05-Apr-16            5.92      22.67          21.72   1.79    3.17   2.614   2.57
05-Apr-17            6.62      26.21          25.47   2.10    3.76   2.706   2.66
05-Apr-18            6.12      33.19          24.66   1.79    3.62   2.797   2.75
05-Apr-19            6.35      31.25          27.04   1.95    3.82   2.856   2.81
05-Apr-20            4.50      31.57          20.59   1.44    2.77   2.926   2.87
05-Apr-21            5.99      22.80          29.07   1.76    3.46   2.960   2.89
The RPI figure is that for February 2021, the latest available.

The summary of charges and fees is:
.        .         Percent     Portfolio   Value    Value at    Percent  
Tax Yr    Trades   Brokerage   Fees        Total            .   Income   
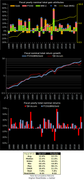
FY08-09       48      0.489%      0.080%   0.569%   05-Apr-09       6.29%
FY09-10       27      0.245%      0.060%   0.305%   05-Apr-10      10.11%
FY10-11       27      0.241%      0.052%   0.294%   05-Apr-11       8.09%
FY11-12       12      0.093%      0.050%   0.143%   05-Apr-12       3.45%
FY12-13       12      0.058%      0.042%   0.100%   05-Apr-13       2.30%
FY13-14       19      0.124%      0.029%   0.152%   05-Apr-14       3.55%
FY14-15       12      0.042%      0.033%   0.075%   05-Apr-15       1.80%
FY15-16       25      0.119%      0.034%   0.152%   05-Apr-16       3.79%
FY16-17       24      0.121%      0.016%   0.137%   05-Apr-17       3.44%
FY17-18       20      0.056%      0.007%   0.063%   05-Apr-18       1.38%
FY18-19       15      0.033%      0.008%   0.041%   05-Apr-19       0.77%
FY19-20       31      0.079%      0.010%   0.089%   05-Apr-20       1.25%
FY20-21       27      0.047%      0.007%   0.054%   05-Apr-21       1.41%
                                                                         
Average       23      0.147%      0.037%   0.185%                  4.088%
Max           48      0.489%      0.080%   0.569%                 10.105%
Min           12      0.033%      0.007%   0.041%                  0.771%
Of the 27 trades, there were 5 trimmings when overweight and one disposal, William Hill, which accounted for two of the trimmings. There were 20 top-ups and one new holding bought, IG Group, replacing WMH. One of the top-ups was reinvesting the special dividend from Tesco.

The current rankings for Yield and weight are:
Yield                               Value                  
Rank    EPIC     Yield   Cum Mean   Rank    EPIC    Weight 
    1   IMB      9.25%      9.25%       1   AV.       3.75%
    2   BATS     7.94%      8.60%       2   PSON      3.48%
    3   RIO      7.45%      8.21%       3   LGEN      3.39%
    4   BP.      6.93%      7.89%       4   BHP       3.34%
    5   GSK      6.26%      7.57%       5   ADM       3.18%
    6   LGEN     6.20%      7.34%       6   IMI       3.18%
    7   VOD      6.03%      7.15%       7   DGE       3.15%
    8   NG.      5.67%      6.97%       8   TATE      3.08%
    9   BHP      5.57%      6.81%       9   RIO       3.02%
   10   SSE      5.49%      6.68%      10   S32       3.01%
   11   AV.      5.13%      6.54%      11   SMDS      2.98%
   12   ADM      5.12%      6.42%      12   BA.       2.97%
   13   IGG      4.75%      6.29%      13   TW.       2.96%
   14   BA.      4.64%      6.17%      14   VOD       2.95%
   15   UU.      4.61%      6.07%      15   SSE       2.93%
   16   TW.      4.53%      5.97%      16   UU.       2.93%
   17   TSCO     4.26%      5.87%      17   KGF       2.90%
   18   PHP      4.19%      5.78%      18   BLND      2.87%
   19   TATE     3.87%      5.68%      19   IGG       2.85%
   20   RDSB     3.69%      5.58%      20   MARS      2.85%
   21   ULVR     3.68%      5.49%      21   PHP       2.84%
   22   BLND     3.30%      5.39%      22   TSCO      2.78%
   23   SMDS     2.90%      5.28%      23   GSK       2.76%
   24   AZN      2.89%      5.18%      24   BP.       2.64%
   25   RKT      2.69%      5.08%      25   NG.       2.63%
   26   KGF      2.53%      4.98%      26   SGRO      2.51%
   27   PSON     2.53%      4.89%      27   RDSB      2.50%
   28   DGE      2.34%      4.80%      28   BATS      2.49%
   29   SGRO     2.33%      4.72%      29   ULVR      2.45%
   30   IMI      1.70%      4.62%      30   BT.A      2.44%
   31   S32      1.66%      4.52%      31   AZN       2.43%
   32   LLOY     1.33%      4.42%      32   RKT       2.21%
   33   MKS      0.00%      4.29%      33   CPG       2.07%
   34   MARS     0.00%      4.16%      34   LLOY      2.03%
   35   BT.A     0.00%      4.04%      35   IMB       1.84%
   36   CPG      0.00%      3.93%      36   MKS       1.63%
                                                           
        Median   4.03%                      Total   100.00%
        Mean     3.93%
Only four non-payers at this stage.

TJH

Dod101
The full Lemon
Posts: 15021
Joined: October 10th, 2017, 11:33 am

Re: TJH Annual Report

Post by Dod101 »

Only 4 non payers??? Bl**dy H*ll. I have/had only ever two cancellations, but the reduced dividends from Shell and Imperial Brands was at least as bad as the cancellations from HSBC and Gleeson (my only two)

I would not be holding BT for instance were I TJH and I cannot understand why anyone would continue to hold it.

I am resolved to try to move away from dependence on UK 'old economy' shares this year but I like dividends so it limits my ambition somewhat.

Dod

dealtn
Lemon Half
Posts: 5676
Joined: November 21st, 2016, 4:26 pm

Re: TJH Annual Report

Post by dealtn »

Dod101 wrote:
I would not be holding BT for instance were I TJH and I cannot understand why anyone would continue to hold it.
Plenty of reasons. Very happy with the >50% return in the last 6 months.

Arborbridge
Lemon Half
Posts: 9905
Joined: November 4th, 2016, 9:33 am

Re: TJH Annual Report

Post by Arborbridge »

Dod101 wrote:Only 4 non payers??? Bl**dy H*ll. I have/had only ever two cancellations, but the reduced dividends from Shell and Imperial Brands was at least as bad as the cancellations from HSBC and Gleeson (my only two)

I would not be holding BT for instance were I TJH and I cannot understand why anyone would continue to hold it.

I am resolved to try to move away from dependence on UK 'old economy' shares this year but I like dividends so it limits my ambition somewhat.

Dod
I'm not sure whether or not I have any non-payers - I'm getting a little confused about who's doing what! And are we including "not yet paid but plan to this year" as non-payers? I don't think I have any of them now (I sold BT) and all the rest say they will pay this something year. I guess the most dubious ones are the two banks HSBC and Lloyds.

Arb.

Dod101
The full Lemon
Posts: 15021
Joined: October 10th, 2017, 11:33 am

Re: TJH Annual Report

Post by Dod101 »

Of my non payers, Gleeson reinstates its dividend on Tuesday and HSBC on 29 April but that leaves the savage cuts from Shell and Imperial . Still, I think I will be close to my overall dividend income for 2019, but we'll see. It is too early to say.

Dod

dealtn
Lemon Half
Posts: 5676
Joined: November 21st, 2016, 4:26 pm

Re: TJH Annual Report

Post by dealtn »

Arborbridge wrote: I guess the most dubious ones are the two banks HSBC and Lloyds.

Arb.
Why are they dubious?

Both have declared dividends, one is now xd, the other will be in less than 2 weeks.

Arborbridge
Lemon Half
Posts: 9905
Joined: November 4th, 2016, 9:33 am

Re: TJH Annual Report

Post by Arborbridge »

dealtn wrote:
Arborbridge wrote: I guess the most dubious ones are the two banks HSBC and Lloyds.

Arb.
Why are they dubious?

Both have declared dividends, one is now xd, the other will be in less than 2 weeks.
Thanks - I might have known that but forgotten it. I don't need long covid to give me brain fog and I'm not great at keeping track - no doubt I could find these things out if it was essential :)
There have been so many up and downs (usually downs) and statements in the past year, my info could always be out of date.
But it's just that banks are always dubious in my mind these days. Dividends have been cancelled even when declared.
I'm chilled about the whole exact information thing - believe it when I see it in my account, so to speak.

88V8
Lemon Quarter
Posts: 4630
Joined: November 4th, 2016, 11:22 am

Re: TJH Annual Report

Post by 88V8 »

tjh290633 wrote:
.            Income Units              Accumulation                  April       
Year to      Unit Value     Div/Unit   Unit Value     FT30   FT100   RPI     RPI 

05-Apr-09            2.28      21.17           6.46   0.87    2.01   2.115   2.08
05-Apr-10            3.69      11.06          10.86   1.33    2.91   2.228   2.19

05-Apr-20            4.50      31.57          20.59   1.44    2.77   2.926   2.87
05-Apr-21            5.99      22.80          29.07   1.76    3.46   2.960   2.89
28% div/unit drop from CV19
48% drop in the Banking crash.

It will be interesting to compare the rates of recovery in the next couple of years. 'Rebasing', anyone?

V8

Arborbridge
Lemon Half
Posts: 9905
Joined: November 4th, 2016, 9:33 am

Re: TJH Annual Report

Post by Arborbridge »

88V8 wrote:
tjh290633 wrote:
.            Income Units              Accumulation                  April       
Year to      Unit Value     Div/Unit   Unit Value     FT30   FT100   RPI     RPI 

05-Apr-09            2.28      21.17           6.46   0.87    2.01   2.115   2.08
05-Apr-10            3.69      11.06          10.86   1.33    2.91   2.228   2.19

05-Apr-20            4.50      31.57          20.59   1.44    2.77   2.926   2.87
05-Apr-21            5.99      22.80          29.07   1.76    3.46   2.960   2.89
28% div/unit drop from CV19
48% drop in the Banking crash.

It will be interesting to compare the rates of recovery in the next couple of years. 'Rebasing', anyone?

V8
Yes indeed, and will the banking crash still sit at the top of our table for bad experiences this lifetime? (oops, I only have one lifetime, but hope is eternal)

I lived through and heard the effects of the real crash of the miners strikes etc, but I had no money to invest then soit went over my head. 1987 was my first crash with money in the game, and I learnt then to smile and come through it without panic.

Arb.

tjh290633
Lemon Half
Posts: 7675
Joined: November 4th, 2016, 11:20 am

Re: TJH Annual Report

Post by tjh290633 »

88V8 wrote:28% div/unit drop from CV19
48% drop in the Banking crash.

It will be interesting to compare the rates of recovery in the next couple of years. 'Rebasing', anyone?

V8
It will, indeed. The last time I carried out an extensive reorganising of my portfolio. This time I am inclined to let nature take its course. The 4 non-payers will surely recover in time, both in price and in dividend payments. I posted on another thread the change in SP of my portfolio this year, and the non-payers had all risen substantially since 1st January:

MARS +30.0%
BT.A +17.0%
MKS +10.7%
CPG +7.2%

That's why I am continuing to hold.

TJH

1nvest
Lemon Quarter
Posts: 3382
Joined: May 31st, 2019, 7:55 pm

Re: TJH Annual Report

Post by 1nvest »

Thanks Terry.

Comparing TJH Accumulation with FT250 total return, to April 2021 has such a small difference in total accumulated value that the red and blue growth progression lines have converged into one

Image

1nvest
Lemon Quarter
Posts: 3382
Joined: May 31st, 2019, 7:55 pm

Re: TJH Annual Report

Post by 1nvest »

This is for FT250 total return with a 4% SWR applied, started each year and reviewed after a decade to see what real (after inflation) gain was evident in addition to that, and how large the SWR value was as a proportion of the 10th year portfolio value.

SWR = 'Safe Withdrawal Rate'. Start with (in this case) 4% of the portfolio value drawn at the start of the first year as your income for that year, and then in subsequent years uplift that £ amount by inflation as the amount drawn as income at the start of subsequent years ... i.e. a nice inflation adjusted income.


Starting 1999, 2000 or 2007 saw negative annualised real gains after discounting income (SWR), such that the SWR value in the 10th years was >4% of the portfolio value, 1999 being the worst case where a initial 4% SWR had risen to being the equivalent of a 4.9% SWR. The other start years all saw break-even in real terms or real annualised gains, such that SWR as a percentage of the 10th year portfolio value was lower.

Given similarities in TJH Accumulation and FT250 total returns and the circumstances over those years, likely TJH Accumulation might have seen similar circumstances if a SWR approach out of total returns were being employed.

More often, one bad decade is preceded or followed by a good decade. April 1999 start date worst case for instance paired with April 2009 start date.

If after the first decade the SWR value as a percentage of portfolio value is down at 2% type levels, then that pretty much becomes a PWR ... a safe Perpetual Withdrawal Rate i.e. a pretty much assured inflation adjusted income for life and beyond.

1nvest
Lemon Quarter
Posts: 3382
Joined: May 31st, 2019, 7:55 pm

Re: TJH Annual Report

Post by 1nvest »

Compared to a third each Berkshire Hathaway, FT250, Gold

Image

Post Reply

Return to “Portfolio Management & Review”