I see this thread is now about a month old, which is a long time in investing.
I tend to run a valuation every few weeks.
As of 9 July, I was about 6% down since early Jan. This put me back to the position I was in about 12 months ago. However on Sunday, 7 Aug, I was back up to a 1% drop YTD.
This excludes non ISA divis and a monthly automated sell down (about 20% of our investments are in a fund that autosells each month and creates a steady income at 3.5% of the original investment), which go into my bank account, probably 0.5% withdrawn over the 7 months.
I hold mainly trackers, about 5% BRK.B, some ITs, and a few income funds outside the ISA. I bought some BRK.B start of Feb and added a few more almost at the bottom ($273, lucky timing), and am now about 5% down on them according to II, however I paid for the first lot in UKP (at 1.33$/£), and the rest in USD from my VEVE dividends (exchange rate was 1.178$/£), so I'm up slightly in sterling equivalent.
Paul
Drop since year end
-
ADrunkenMarcus
- Lemon Quarter
- Posts: 1519
- Joined: November 5th, 2016, 11:16 am
Re: Drop since year end
As of yesterday's close, my portfolio (accumulation unit value) was roughly flat in comparing it with 10 January 2022. I don't have 1 January 2022 data.
There's a full table of my holdings in my last review. There have been no trades since:
viewtopic.php?p=501995#p501995
It's a sobering thought to compare that with the rate of inflation, because as things stand I will need a gain of 13+% simply to break even in real terms by the calendar year end.
Best wishes
Mark.
-
tjh290633
- Lemon Half
- Posts: 7675
- Joined: November 4th, 2016, 11:20 am
Re: Drop since year end
Just checked my position as of last night.
Incorrect. See below.
This year    Inc Units   FTSE       Acc Units
31-Dec-21         6.42   7,384.54       32.61
10-Aug-22         6.45   7,488.15       33.06
                 0.39%      1.40%       1.36%
TJHIncorrect. See below.
-
simoan
- Lemon Quarter
- Posts: 1708
- Joined: November 5th, 2016, 9:37 am
Re: Drop since year end
I’m not sure I see the point of this exercise? GBP weakness, in particular against USD, is boosting returns and dividends for many people. I wouldn’t normally take it into account but the 10% change in USD/GBP year to date is significant and is covering a more serious underperformance in constant currency I.e. if you hold an S&P500 tracker priced in GBP it has limited your losses a great deal.
-
tjh290633
- Lemon Half
- Posts: 7675
- Joined: November 4th, 2016, 11:20 am
Re: Drop since year end
Thanks to Bagger, who noticed a discrepancy. My figures since the year end are:
This year    Inc Units   FTSE       Acc Units
31-Dec-21         6.42   7,384.54       32.61
10-Aug-22         6.45   7,488.15       33.43
                 0.39%      1.40%       2.50%
TJH-
monabri
- Lemon Half
- Posts: 7482
- Joined: January 7th, 2017, 9:56 am
Re: Drop since year end
Less than a month later....monabri wrote:
Reversing out dividends paid and reinvested as though they had simply been withdrawn..
31/12/21 to Friday 15/07/22 - Down 7.1%
31/12/21 to 10/08/22 - Up 0.6%
Helped no doubt by today's Aviva & Admiral sentiment and recent HSBA recovery. If I add back in the dividends, the TR is only 0.1% lower than the all time portfolio high in February 2022.
-
Myfyr
- 2 Lemon pips
- Posts: 125
- Joined: November 4th, 2016, 2:34 pm
Re: Drop since year end
My SIPP was 12% down YTD at the start of July, now only 2% down. Maybe I could have retired after all. 
How does one kick the one more year syndrome? It’s energy price fears that are stopping me now.
How does one kick the one more year syndrome? It’s energy price fears that are stopping me now.
-
DrFfybes
- Lemon Quarter
- Posts: 2664
- Joined: November 6th, 2016, 10:25 pm
Re: Drop since year end
Yup, the last couple of days and I'm now back to year end figures.Myfyr wrote:My SIPP was 12% down YTD at the start of July, now only 2% down. Maybe I could have retired after all.
How does one kick the one more year syndrome? It’s energy price fears that are stopping me now.
Erm, you can't kick the "one more year" thing. What you can do is go part time, or take a year out and see how you get on (or see how your emplyer gets on without you and then offer to go back part time).
-
Darka
- Lemon Slice
- Posts: 752
- Joined: November 4th, 2016, 2:18 pm
Re: Drop since year end
At some point you have to work out which is more important; one more year or dying whilst still working before you get any chance to enjoy your retirement.Myfyr wrote:My SIPP was 12% down YTD at the start of July, now only 2% down. Maybe I could have retired after all.
How does one kick the one more year syndrome? It’s energy price fears that are stopping me now.
As we approach retirement, we are edging towards the end game and granted that will hopefully be decades away but health problems and other nasty surprises can come along at any time.
Time is one thing you will never get back.
-
Newroad
- Lemon Slice
- Posts: 841
- Joined: November 23rd, 2019, 4:59 pm
Re: Drop since year end
Evening Dod et al.
Post Wednesday's II "free reinvesting" day, I did my usual half monthly evaluation. Further to my July 19th update where I noted
Regards, Newroad
Post Wednesday's II "free reinvesting" day, I did my usual half monthly evaluation. Further to my July 19th update where I noted
- "The good (or at least, less bad) news is that from -11.26% (best) to -14.71% (worst) noted above, there has been an improvement to -8.99% (best) to -12.09% (worst) - still since 31/12/2021."
- "Interactive Investor said the average Isa portfolio on its platform lost 16 per cent in the year to June."
Regards, Newroad
-
tjh290633
- Lemon Half
- Posts: 7675
- Joined: November 4th, 2016, 11:20 am
Re: Drop since year end
What on earth are they doing? I know that I am not getting results that are anything special, but at least they are positive.Newroad wrote:Evening Dod et al.
Post Wednesday's II "free reinvesting" day, I did my usual half monthly evaluation. Further to my July 19th update where I noted
it is now -3.22% (best) to -8.22% worst. I also noticed in an FT article this evening (https://www.ft.com/content/a4b1250b-173 ... c2114380ae) that
- "The good (or at least, less bad) news is that from -11.26% (best) to -14.71% (worst) noted above, there has been an improvement to -8.99% (best) to -12.09% (worst) - still since 31/12/2021."
For us over that time period the ISA's were -9.76% and the JISA's -7.31%. Not great of course, but at least above average.
- "Interactive Investor said the average Isa portfolio on its platform lost 16 per cent in the year to June."
Regards, Newroad
For the shares in my portfolio, there is a wide spread of price movements since 31 Dec 21:
Epic     Change    Yield
BA.       46.05%    3.21%
PSON      43.38%    2.38%
SHEL      38.59%    3.48%
BP.       35.49%    3.96%
AZN       29.64%    2.01%
BATS      26.78%    6.34%
TATE      19.53%    2.76%
IMB       18.16%    5.25%
CPG       18.14%    1.19%
WDS       15.39%    5.74%
SSE       11.67%    4.67%
S32       10.83%    4.38%
NG.       10.26%    4.37%
BHP        8.52%   10.85%
VOD        8.44%    6.21%
AV.        6.48%    5.69%
RKT        5.23%    2.68%
UU.        4.13%    3.80%
IGG        3.44%    3.12%
ULVR       1.48%    3.66%
RIO        0.40%   11.60%
DGE       -1.88%    1.95%
PHP       -3.76%    4.43%
LLOY      -6.23%    6.91%
TSCO      -6.55%    4.03%
BT.A      -7.25%    5.09%
LGEN      -9.24%    5.00%
GSK      -11.29%    4.05%
BLND     -12.73%    4.63%
HLN      -16.95%    3.12%
ADM      -26.45%    7.70%
SMDS     -26.52%    5.23%
KGF      -29.09%    1.92%
SGRO     -29.13%    2.37%
IMI      -29.21%    7.30%
TW.      -32.17%    7.48%
MARS     -42.83%    4.66% (to disposal)
MKS      -43.26%    0.00%

Av.Chg     0.72%    4.56%
I've just looked at the ITs and funds that I hold, and they are definitely abysmal.
Witan -8.53%
F&C -1.19%
Alliance -1.36%
The only two funds showing a gain are JP Morgan Natural Resources, +25% YTD, with Newton Income showing +1.93% YTD. I will not bore you with the rest, but Newton Oriental with -14.5% YTD holds the wooden spoon.
There is something to be said about following the HYP idea.
TJH
-
GoSeigen
- Lemon Quarter
- Posts: 3934
- Joined: November 8th, 2016, 11:14 pm
Re: Drop since year end
Our values are about -4.5% overall but our ii accounts are -7% so perhaps II has a jinx or something... funnily enough almost all our (severe) Russia losses have been in non-II accounts...Newroad wrote:Evening Dod et al.
Post Wednesday's II "free reinvesting" day, I did my usual half monthly evaluation. Further to my July 19th update where I noted
it is now -3.22% (best) to -8.22% worst. I also noticed in an FT article this evening (https://www.ft.com/content/a4b1250b-173 ... c2114380ae) that
- "The good (or at least, less bad) news is that from -11.26% (best) to -14.71% (worst) noted above, there has been an improvement to -8.99% (best) to -12.09% (worst) - still since 31/12/2021."
For us over that time period the ISA's were -9.76% and the JISA's -7.31%. Not great of course, but at least above average.
- "Interactive Investor said the average Isa portfolio on its platform lost 16 per cent in the year to June."
Regards, Newroad
GS
-
Dod101
- The full Lemon
- Posts: 15021
- Joined: October 10th, 2017, 11:33 am
Re: Drop since year end
I have just been reading the current IC and it tells us that the value oriented UK market is doing much better than say the US market at the moment and that I think helps explain the relatively poor showing from some of the big generalist ITs which are substantially invested overseas, with a lot in the US market.
It goes on to say that the UK market represents good value at the moment.
As of last week, my portfolio is down 3.3% since year end and about half of that is held with II, not that that has anything to do with it.
Dod
It goes on to say that the UK market represents good value at the moment.
As of last week, my portfolio is down 3.3% since year end and about half of that is held with II, not that that has anything to do with it.
Dod
-
Dod101
- The full Lemon
- Posts: 15021
- Joined: October 10th, 2017, 11:33 am
Re: Drop since year end
There is no point in this thread now. If you look at my opening post though I was posting at that time against a specific comment at the time about diversification and its possible benefits.simoan wrote:I’m not sure I see the point of this exercise? GBP weakness, in particular against USD, is boosting returns and dividends for many people. I wouldn’t normally take it into account but the 10% change in USD/GBP year to date is significant and is covering a more serious underperformance in constant currency I.e. if you hold an S&P500 tracker priced in GBP it has limited your losses a great deal.
Dod
-
Newroad
- Lemon Slice
- Posts: 841
- Joined: November 23rd, 2019, 4:59 pm
Re: Drop since year end
Hi Terry.
You ask "What on earth are they doing?". Clearly, I don't have access to the II data, but my guess is an overweight exposure to, predominantly US, technology stocks - quite possibly in many cases via an overweight exposure to SMT, MNKS and similar. At a small level, this has affected the JISA's for us with their MNP exposure.
Obviously, that's less of an issue with long term holders thereof, but nevertheless, may be a good argument for rebalancing at some level. It also goes, perhaps, to Dod's original point about diversification.
On another note, I would caution against drawing conclusions re the efficacy or otherwise of HYP's - what we have been discussing in this thread is too short a period - and their performance varies too. My actual unitisation is below and includes my pseudo-HYP (being built up one share per month, so it started after the start of the year). IBKR represents the pseudo-HYP

It's currently BATS, GSK, LAND, LGEN, RIO, TW., VOD - and I've now rebased it so that it commences from where the others were at its starting point. As you can see, it's started to "underperform" once the US markets have begun to recover. Of course, this reflects at some level my own interpretation of the pseudo-HYP, but from what I understand, my selections thus far are not off the wall. In any case, I'm still going to carry on with my pseudo-HYP experiment - I haven't yet even got to my first round target of one stock per each of the 11 sectors.
My current take about HYP's is subject to two IF's and a THEN: if you're willing to risk home country bias and if you're willing to purchase individual stocks then a HYP may well be the best approach for you. I remain of the opinion, however, that the first IF is not the risk to take for long term investing across a whole portfolio (and in a different way again goes to Dod's point about diversification) with the jury out on the second.
Regards, Newroad
You ask "What on earth are they doing?". Clearly, I don't have access to the II data, but my guess is an overweight exposure to, predominantly US, technology stocks - quite possibly in many cases via an overweight exposure to SMT, MNKS and similar. At a small level, this has affected the JISA's for us with their MNP exposure.
Obviously, that's less of an issue with long term holders thereof, but nevertheless, may be a good argument for rebalancing at some level. It also goes, perhaps, to Dod's original point about diversification.
On another note, I would caution against drawing conclusions re the efficacy or otherwise of HYP's - what we have been discussing in this thread is too short a period - and their performance varies too. My actual unitisation is below and includes my pseudo-HYP (being built up one share per month, so it started after the start of the year). IBKR represents the pseudo-HYP
It's currently BATS, GSK, LAND, LGEN, RIO, TW., VOD - and I've now rebased it so that it commences from where the others were at its starting point. As you can see, it's started to "underperform" once the US markets have begun to recover. Of course, this reflects at some level my own interpretation of the pseudo-HYP, but from what I understand, my selections thus far are not off the wall. In any case, I'm still going to carry on with my pseudo-HYP experiment - I haven't yet even got to my first round target of one stock per each of the 11 sectors.
My current take about HYP's is subject to two IF's and a THEN: if you're willing to risk home country bias and if you're willing to purchase individual stocks then a HYP may well be the best approach for you. I remain of the opinion, however, that the first IF is not the risk to take for long term investing across a whole portfolio (and in a different way again goes to Dod's point about diversification) with the jury out on the second.
Regards, Newroad
-
tjh290633
- Lemon Half
- Posts: 7675
- Joined: November 4th, 2016, 11:20 am
Re: Drop since year end
It may be me, or my monitor, but I can only see one line there. I have just had a look on my mobile phone and can just see the yellow IBKR line.Newroad wrote: On another note, I would caution against drawing conclusions re the efficacy or otherwise of HYP's - what we have been discussing in this thread is too short a period - and their performance varies too. My actual unitisation is below and includes my pseudo-HYP (being built up one share per month, so it started after the start of the year). IBKR represents the pseudo-HYP
So BATS are up +26.8% so far, GSK are -11.3%, LAND I don't have, but BLND are -12.7%, LGEN are -9.2%, RIO are +0.4%, TW. are -32.2% and VOD is up +8.4%. You can see why you are down, but of course you need more shares to be representative. My average of the 37 shares is currently 0.72% YTD.Newroad wrote:It's currently BATS, GSK, LAND, LGEN, RIO, TW., VOD
Had you chosen BA., PSON, SHEL, AZN, BATS, TATE and CPG you would have a totally different result, ranging from 18% to 46%, with a median of about 30%. Admittedly PSON, AZN and CPG would not qualify as HYP shares at the moment, but I just went down my list. Income matters, of course.
TJH
-
Newroad
- Lemon Slice
- Posts: 841
- Joined: November 23rd, 2019, 4:59 pm
Re: Drop since year end
I agree on the last point, Terry.
It's too early to tell for my pseudo-HYP and only once it's more developed will a considered view be able to be formed. Further, even the order the shares were purchased in matters. Of course, I could just buy all eleven shares at once for the first round, but, that gives a different kind of timing issue (and late March would not have been a great time to start that)!
However, I think my other points remain valid too and one needs to consider matters in the round and over time. I don't have an axe to grind as is self-evident: I am trying a HYP-like experiment in good faith.
Yes, sorry about the viewability of the graph - but it serves its purpose for me - it's not intended for an online audience. I thought it helpful to include it for illustrative purposes. The thick black line is the average of the ISA's, JISA's and SIPP's. The thick yellow line is the IBKR (pseudo-HYP). The thin blue, red and green lines are the ISA's, JISA's and SIPP's respectively - but they are thin for a purpose (not to make the graph too busy and to allow focus on the black line).
Regards, Newroad
-
csearle
- Lemon Quarter
- Posts: 4462
- Joined: November 4th, 2016, 2:24 pm
Re: Drop since year end
Moderator Message:
Several fairly pointless posts (mainly bickering) removed. - Chris
Several fairly pointless posts (mainly bickering) removed. - Chris
-
Newroad
- Lemon Slice
- Posts: 841
- Joined: November 23rd, 2019, 4:59 pm
Re: Drop since year end
Hi All.
With all the action in the markets, it would seem a good time to look at overall performance. See below for updated end-of-month unit prices - detail of their genesis etc further up in the thread.

One thing is clear thus far, in the shortish term, the well-diversified Global 60/40'ish portfolios are doing better than the UK Pseudo-HYP experiment (IBKR above). Luckily, the latter only forms just over 1.5% of the family's equity/bond/cash investments.
Regards, Newroad
With all the action in the markets, it would seem a good time to look at overall performance. See below for updated end-of-month unit prices - detail of their genesis etc further up in the thread.
One thing is clear thus far, in the shortish term, the well-diversified Global 60/40'ish portfolios are doing better than the UK Pseudo-HYP experiment (IBKR above). Luckily, the latter only forms just over 1.5% of the family's equity/bond/cash investments.
Regards, Newroad
-
1nvest
- Lemon Quarter
- Posts: 3382
- Joined: May 31st, 2019, 7:55 pm
Re: Drop since year end
FT250 stocks are ranging from 1 year down more than -80% to up near +60%. Index -29%, median stock -25%, average -24%
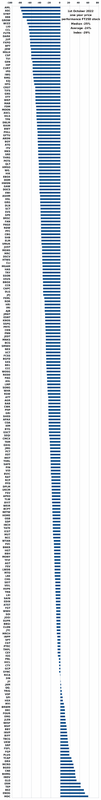
a.k.a. UK smaller caps are getting killed by high energy costs and rising cost of debt, which may leave little left for LT/KK's desired growth ambitions, where the main work for millions newly unemployed might be jogging up and down the stairs at home trying to keep warm.
a.k.a. UK smaller caps are getting killed by high energy costs and rising cost of debt, which may leave little left for LT/KK's desired growth ambitions, where the main work for millions newly unemployed might be jogging up and down the stairs at home trying to keep warm.